Attach rate and tie ratio are terms that are often used interchangeably in the global gaming industry – even though they shouldn’t be.
Generally speaking, games have attach rates – while consoles have tie ratios.
Nothing in the following is rocket science, but I am trying to propose a simple explanation for these metrics and show why tie ratios should not be used to evaluate platform health anymore.
Attach Rates Are For Games
The attach rate is the result of dividing the number of units an individual game has sold by the number of consoles sold.
Looking at Animal Crossing on the Switch for example, Nintendo discloses that the game sold 22.4 million times against a hardware install base of 61.44 million as of June 30, 2020.
This brings us to a (quite incredible) attach rate of 36.5% (22.4/61.44).
In other words, more than every third Switch owner bought that particular piece of software.
Naturally, attach rates can change over time – until the system or game are not being produced anymore.
It’s also often interesting to compare attach rates for multi-platform games across different systems, i.e. to explore why a certain title has sold relatively better on the Xbox than on a PlayStation.
Calculating attach rates generally makes sense.
Tie Ratios Are For Consoles
The tie ratio is the result of total software units sold divided by total hardware units sold.
Looking back at the seventh generation of consoles, for example, Sony managed to sell-in 999.4 million PS3 games and 87.4 million PS3 units (as of March 31, 2019).
This means the PS3 boasts a tie ratio of 999.4/87.4=11.43.
In other words, every PS3 owner bought 11.43 games on average.
The PS3 is discontinued, but people can still buy games for the system, which means the tie ratio will only increase in this case – until Sony cuts off software supply altogether.
It’s also possible to measure tie ratios over time and while the console in question is still on sale.
Many of my clients in finance, for example, measured the tie ratio of the Switch in 2018 vs 2019 to partially judge Nintendo’s overall performance based on the change in that metric.
But once again, I think tie ratios are misleading as a metric, especially nowadays.
Tie Ratios Were Always Tricky
Tie ratios have always been faulty to a degree: for example, a given console can be successful but have a low tie ratio if the hardware is selling exceptionally well.
For instance, the PS2 was used by a number of users primarily as a DVD player, many Wii buyers only played Wii Sports, and it’s likely Tetris was the single game a substantial number of Game Boy users ever owned.
Another example for why tie ratios by themselves should always be handled with care: both Nintendo’s Gamecube and Sony’s PS2 finished their lifecycles with tie ratios of around 10.
But who cares?
On a unit basis, Sony sold over seven times the amount of hardware and software – which means the tie ratio here suggests a similar health of the business but fails to show how the company destroyed Nintendo in that generation on an absolute basis.
There are a lot of other points that could be made in this context, but I will skip those for brevity.
Cheap Games Shake Up Tie Ratios
Today, I believe tie ratios have lost even more of their meaning because of the advent of digital storefronts and the subsequent rise of quickly discounted blockbusters, cheap shovel ware in retail and even more so digitally, or low-priced indie games flooding the markets.
To put it simply: people can buy more games for less money today, so the number of units sold per hardware makes less sense to gauge a console’s performance than ever.
For example, Sony’s digital Playstation Store currently offers hundreds of games for PS4 for under US$10 – not counting free-to-play titles, micro-transactions or retro (PS2 and PS3) software.
Some full games can even be purchased for US$0.01 digitally nowadays.
Theoretically, a console user today can use the classic US$60 for a full game to buy dozens of digital titles, skewing the tie ratio upwards significantly.
Therefore, it makes absolutely no sense to compare PS4 tie ratios with PS1 or PS2 for example, as these phenomena didn’t exist when these consoles were around.
To make things worse, the tie ratio can’t take into account “new” monetization channels such as paid downloadable content, micro-transactions (virtual item sales, battle passes, etc.) or subscriptions.
The Solution Is Simple: Dollar Sales
The obvious solution for this dilemma is to simply ignore tie ratios or only acknowledge them as nice-to-know metrics.
If the goal is still to measure platform health by putting hardware against software sales, it makes a lot more sense to switch from the unit paradigm to cold hard cash.
In other words, it is a much better solution to opt for “dollar sales per hardware unit” as a metric (platform total sales in dollars divided by number of hardware units sold).
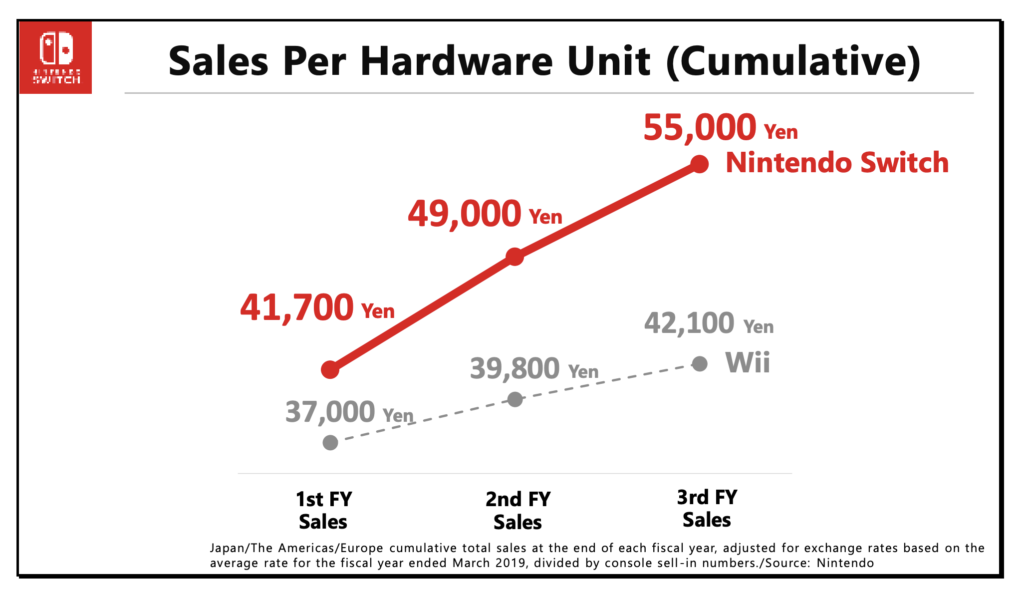
In 2019, Nintendo used this approach for the first time to depict platform health (in yen) not only for the Switch over time but also in contrast with the Wii:
This approach is not only plausible but also could include revenue from downloadable content, micro-transactions, subscriptions – and even accessory sales.
As a metric, “dollar sales per hardware unit” doesn’t sound as catchy as the still widely used “tie ratio” – but is a lot more meaningful.